
Real Estate Prices in Valencia (Spain) in 2026: Prices per Square Meter by Neighborhood, Rents, and Returns
Valencia, Madrid, or Barcelona: Valencia is the least expensive of the three
Before going into detail about the neighborhoods, one thing is clear. Of Spain’s three major cities, Valencia is by far the least expensive: in September 2026, the price per square meter there was €3,473, compared to €5,462 in Barcelona and €6,458 in Madrid.
Source: Idealista, average sale prices listed in September 2026 in Valencia, Barcelona, and Madrid. Floor areas rounded to the nearest square meter.
Why Valencia Has the Greatest Growth Potential
First, the price difference is significant: for the same budget as an apartment in Madrid, you can buy nearly twice as much living space in Valencia. Second, Valencia is growing at the same pace as Barcelona (+5.1% versus +5.8% year-over-year) and twice as fast as Madrid (+2.4%), where prices have actually been falling slightly since their record high in April 2026. Finally, the city continues to attract more and more international buyers and renters, drawn by the sea, the climate, and a lower cost of living.
In other words, Valencia is starting from a much lower baseline while growing just as fast as the most dynamic of the three cities. That is why it currently offers the greatest room for growth—and thus the best potential for appreciation—for a buyer entering the market now.
Real Estate Prices in Valence in 2026: Key Figures
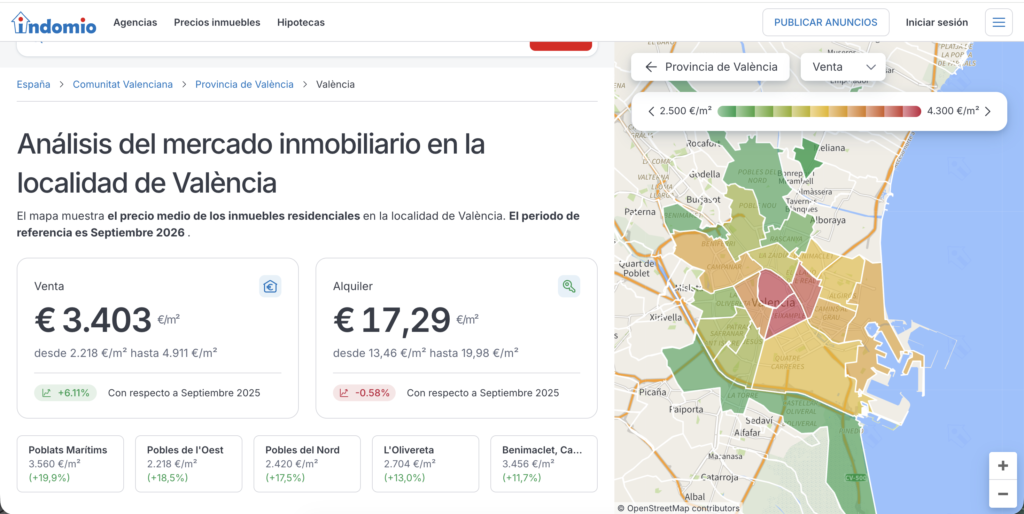
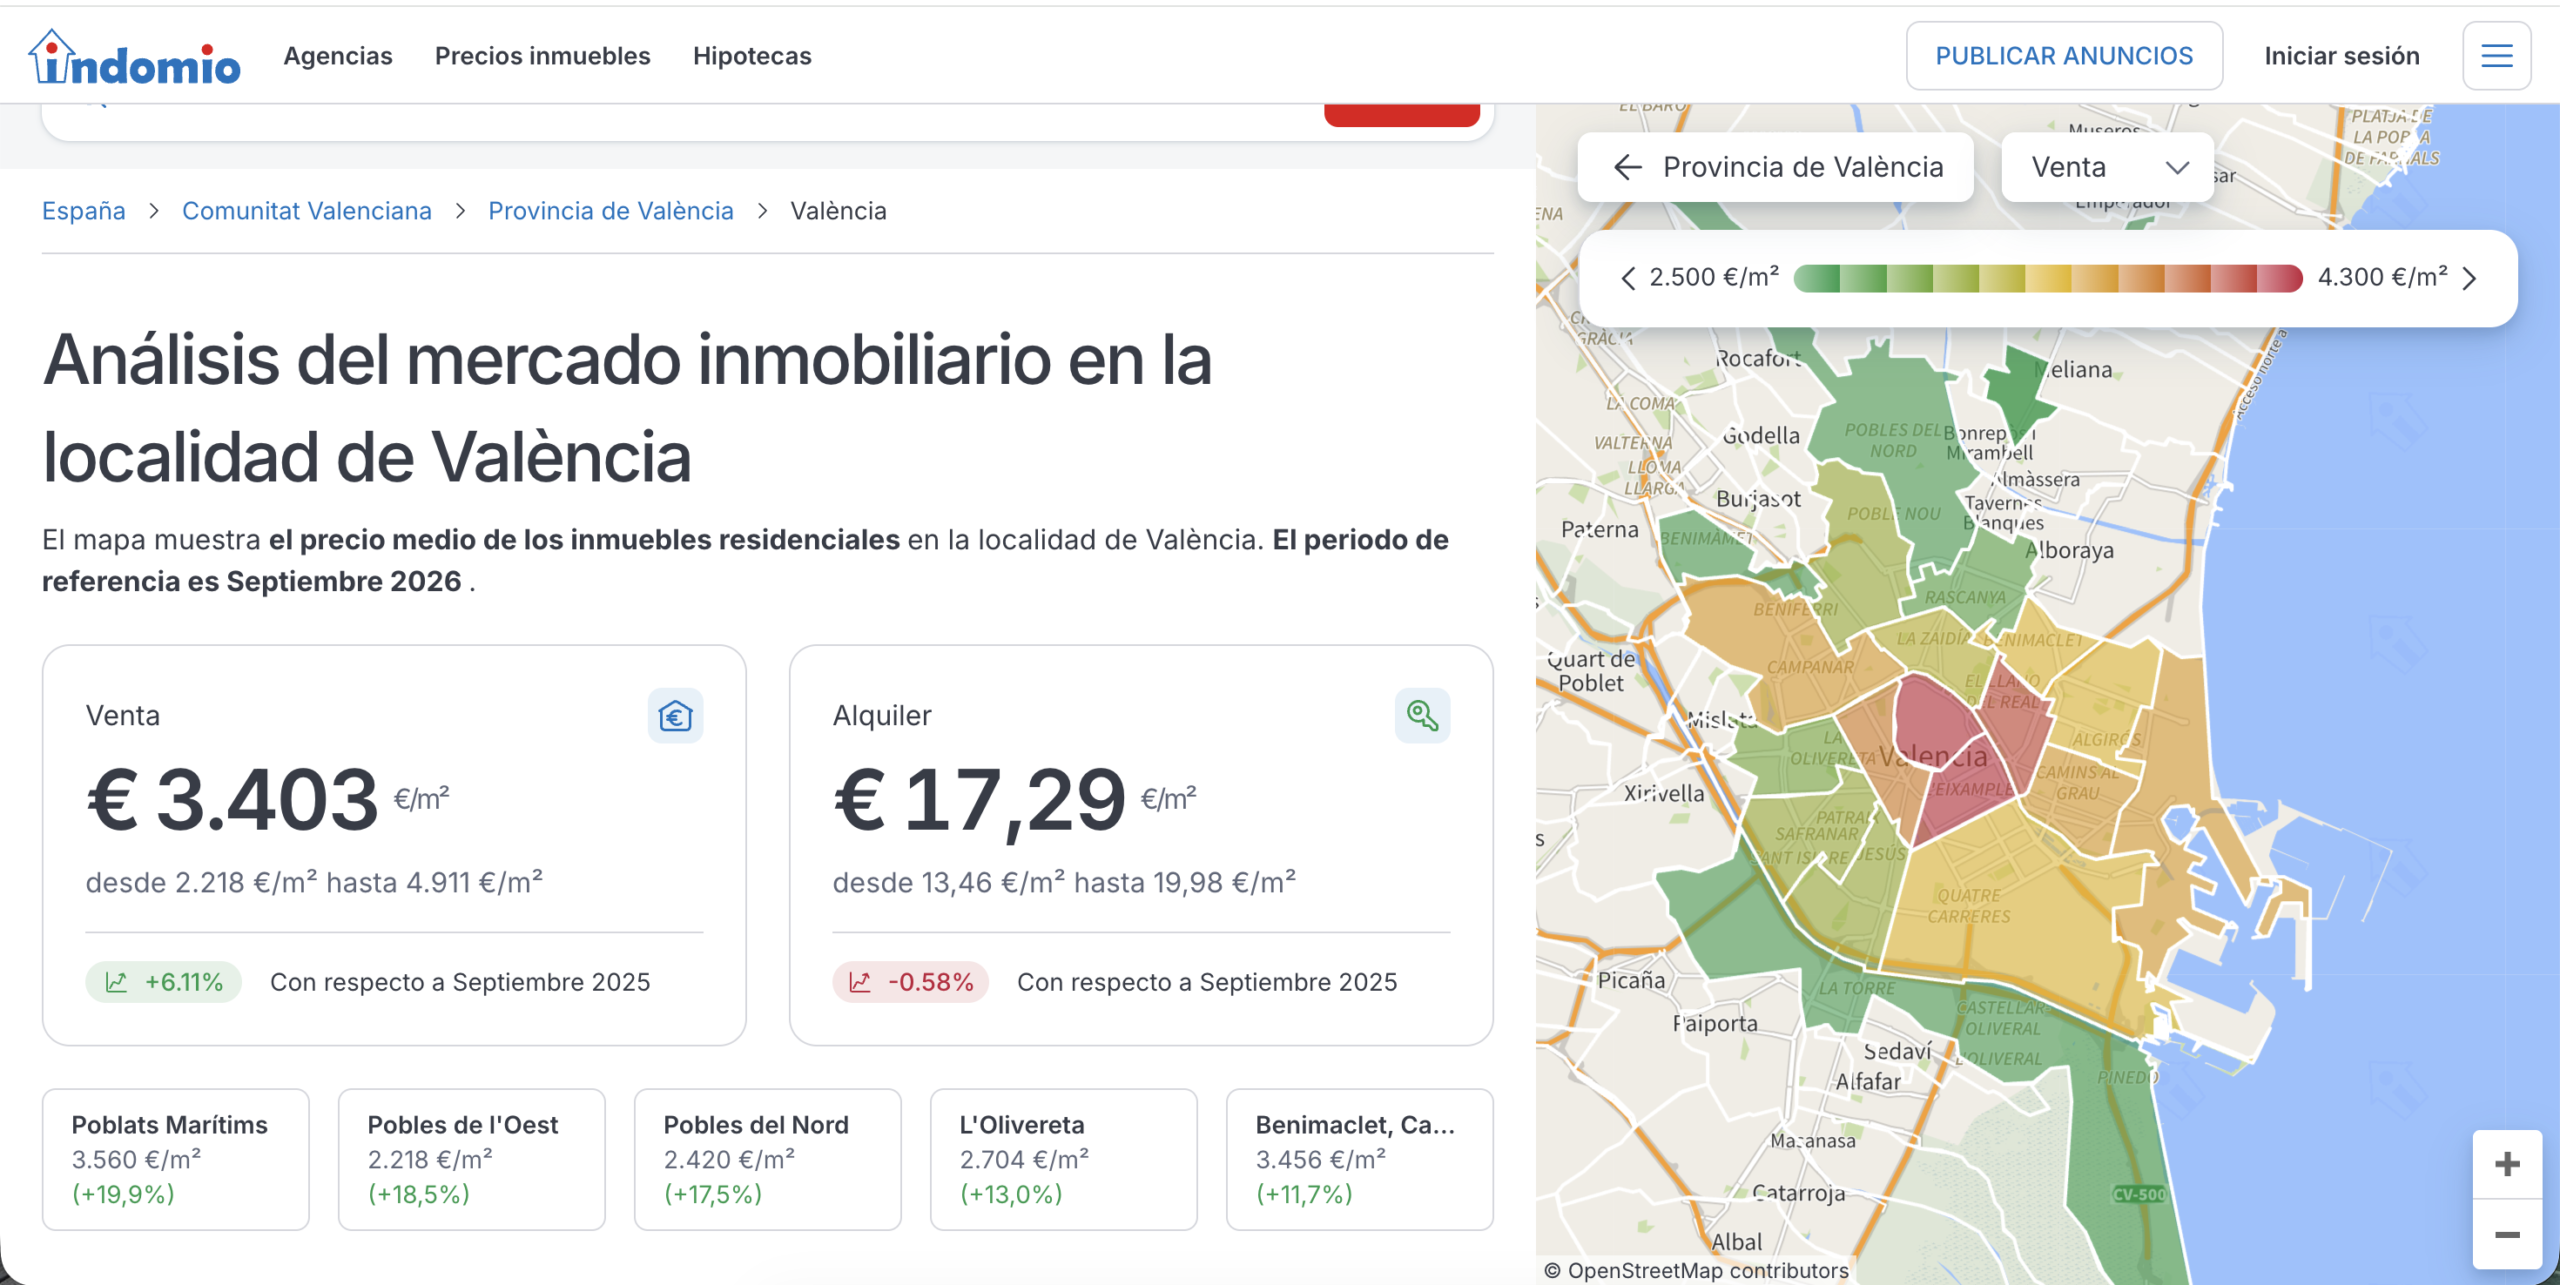
Why multiple sources? To be as comprehensive as possible, this article cross-references three sources, which are always listed next to each figure: Idealista (asking prices in listings, our primary source), Indomio (another real estate listing portal, which also covers outlying districts), and the Spanish notary’s office (actual sale prices). This is why the figures differ slightly from one source to another: for example, in September 2026, Indomio reported an average price of €3,403/m² in Valencia (+6.1% year-over-year), compared to €3,473/m² for Idealista, as shown on the map below.
How much does real estate cost in Valencia, Spain?
In September 2026, the average real estate price in Valencia reached €3,473/m², up 5.1% year-over-year, according to Idealista. Depending on the neighborhood, prices range from €2,186/m² in Natzaret to €5,946/m² in Pla del Remei, according to Idealista. The average monthly rent is €16.3 per square meter, according to Idealista, resulting in an average gross yield of approximately 5.6%, as calculated by Terreta.
Valencia is divided into 19 districts and 87 neighborhoods. However, knowing the name of the district is no longer enough: in fact, two neighborhoods within the same district can have very different prices and returns. That is why this ranking goes beyond the district-level average and drills down to the neighborhood level, where investment decisions are actually made.
Real Estate Prices in Valence by District and Neighborhood: Prices per Square Meter, Rents, and Returns
1Rascanya
Orriols, Torrefiel, Sant Llorenç
| Neighborhood | Price per square meter | Year-over-year | Good to Know |
|---|---|---|---|
| Torrefiel | €2,428 per square meter | +6,2 % | The most active in the district |
| Els Orriols | 2,352 €/m² | +22,5 % | Sharp increase, strong rental demand |
| Sant Llorenç | n.a. | n.a. | Quiet, family-friendly |
2Benicalap
Benicalap, Ciutat Fallera
| Neighborhood | Price per square meter | Year-over-year | Good to Know |
|---|---|---|---|
| Nou Benicalap | 3,590 €/m² | +14,2 % | New Residential Development |
| Benicalap | 2,737 €/m² | +14,9 % | Near Nou Mestalla |
| Ciutat Fallera | 2,319 €/m² | +3,3 % | The most accessible in the district |
3 L'Olivereta
Nou Moles, Soternes, Tres Forques, La Fuensanta, La Llum
| Neighborhood | Price per square meter | Year-over-year | Good to Know |
|---|---|---|---|
| Nou Moles | 2,833 €/m² | +6,8 % | Most Popular |
| Soternes | 2,821 €/m² | n.a. | Family home |
| La Llum | 2,640 €/m² | n.a. | Affordable |
| Tres Forques | 2,506 €/m² | +15,1 % | A strong comeback |
4Jesus
La Raiosa, L'Hort de Senabre, La Creu Coberta, Sant Marcel·lí, Camí Real
| Neighborhood | Price per square meter | Year-over-year | Good to Know |
|---|---|---|---|
| La Raiosa | 2,919 €/m² | −5,4 % | Dynamic, young |
| The Senabre Garden | 2,819 €/m² | +7,8 % | Greenery, park |
| Sant Marcel·lí | 2,798 €/m² | +20,6 % | Sharp increase |
5 PoblatsMarítims
El Grau, El Cabanyal-Canyamelar, La Malvarrosa, Beteró, Natzaret
| Neighborhood | Price per square meter | Year-over-year | Good to Know |
|---|---|---|---|
| El Cabanyal-Canyamelar | 3,750 €/m² | +10,8 % | Very trendy, beach |
| Beteró | 3,305 €/m² | +24,5 % | Beachfront residential properties, sharp increase |
| El Grau | 3,256 €/m² | +10,0 % | Port, good liquidity |
| Malvarrosa Beach | 3,078 €/m² | +9,2 % | Waterfront |
| Nazareth | 2,186 €/m² | +10,4 % | The Most Accessible in Valencia |
6Campanar
Campanar, Les Tendetes, El Calvari, Sant Pau
| Neighborhood | Price per square meter | Year-over-year | Good to Know |
|---|---|---|---|
| Sant Pau | 4,412 €/m² | −2,9 % | Quiet, sophisticated |
| Nou Campanar | 3,908 €/m² | n.a. | Modern residential |
| Campanar | 3,446 €/m² | +12,0 % | Near the hospital |
| El Calvari | 3,015 €/m² | n.a. | The most accessible in the district |
7LaSaïdia
Marxalenes, Morvedre, Trinitat, Tormos, Sant Antoni
| Neighborhood | Price per square meter | Year-over-year | Good to Know |
|---|---|---|---|
| Morvedre | 3,173 €/m² | +1,7 % | Calm |
| Trinitat | 3,121 €/m² | −9,0 % | Residential |
| Sant Antoni | 2,917 €/m² | n.a. | Calm |
| Marxalenes | 2,897 €/m² | +10,6 % | Near the Viveros Gardens |
| Tormos | 2,697 €/m² | +4,6 % | The most accessible in the district |
8Caminsal Grau
Aiora, Albors, La Creu del Grau, Camí Fondo, Penya-Roja
| Neighborhood | Price per square meter | Year-over-year | Good to Know |
|---|---|---|---|
| Penya-Roja | 4,933 €/m² | +4,0 % | Modern, near Cité des Arts |
| Camí Fondo | 3,187 €/m² | +0,5 % | Calm |
| Aiora | 3,182 €/m² | +7,0 % | Well-connected |
| La Creu del Grau | 3,150 €/m² | +1,6 % | More affordable |
| Albors | 3,042 €/m² | −5,5 % | More affordable |
9FourCareers
Monteolivet, En Corts, Malilla, Font de Sant Lluís, Na Rovella, La Punta, City of Arts and Sciences
| Neighborhood | Price per square meter | Year-over-year | Good to Know |
|---|---|---|---|
| City of Arts and Sciences | 5,172 €/m² | +14,2 % | New, high-end |
| La Punta | 3,536 €/m² | n.a. | Near Albufera |
| In Corts | 3,203 €/m² | +5,1 % | Downtown, residential |
| Monteolivet | 3,120 €/m² | +6,2 % | Near downtown |
| Malilla | 3,077 €/m² | +2,7 % | In high demand |
| Na Rovella | 2,958 €/m² | +16,9 % | More affordable |
10Patraix
Patraix, Sant Isidre, Vara de Quart, Safranar, Favara
| Neighborhood | Price per square meter | Year-over-year | Good to Know |
|---|---|---|---|
| Safranar | 3,385 €/m² | n.a. | Residential |
| Patraix | 2,960 €/m² | +3,1 % | Heart of the District |
| Sant Isidre | 2,847 €/m² | n.a. | Quieter |
| Vara de Quart | 2,634 €/m² | +9,5 % | Strong growth |
11Algirós
L'Illa Perduda, Ciutat Jardí, L'Amistat, La Bega Baixa, La Carrasca
| Neighborhood | Price per square meter | Year-over-year | Good to Know |
|---|---|---|---|
| Ciutat Jardí | 3,382 €/m² | +6,5 % | High-end residential |
| L'Amistat | 3,333 €/m² | +5,5 % | Quieter |
| The Lost Island | 3,211 €/m² | n.a. | Nearby universities |
12Outside the Walls
El Botànic, La Roqueta, La Petxina, Arrancapins
| Neighborhood | Price per square meter | Year-over-year | Good to Know |
|---|---|---|---|
| La Roqueta | 4,211 €/m² | +0,8 % | Near Gare du Nord |
| El Botànic | 3,852 €/m² | −1,0 % | Trendy, university |
| Nutcracker | 3,685 €/m² | +6,3 % | Central, middle-class |
| La Petxina | 3,683 €/m² | +5,9 % | Near Turia Park |
13Benimaclet
Benimaclet, Camí de Vera
| Neighborhood | Price per square meter | Year-over-year | Good to Know |
|---|---|---|---|
| Benimaclet | 3,548 €/m² | +20,4 % | A small-town atmosphere, students |
| Camí de Vera | n.a. | n.a. | Near UPV universities |
14 ElPla del Real
Exposició, Mestalla, Jaume Roig, Ciutat Universitària
| Neighborhood | Price per square meter | Year-over-year | Good to Know |
|---|---|---|---|
| Exhibition | 4,569 €/m² | −2,0 % | Near the Turia Gardens |
| Mestalla | 3,982 €/m² | +3,8 % | Near the stadium |
| Jaume Roig | n.a. | n.a. | Upper-middle-class residential |
| University City | n.a. | n.a. | UV Campus |
15 CiutatVella
La Seu, La Xerea, El Carme, El Pilar (Velluters), El Mercat, Sant Francesc
| Neighborhood | Price per square meter | Year-over-year | Good to Know |
|---|---|---|---|
| Saint Francis | 5,667 €/m² | +13,3 % | Central, tourist-friendly |
| El Mercat | 4,962 €/m² | +6,7 % | Lively Old Town |
| The Xerea | 4,894 €/m² | +8,1 % | Historical, heritage |
| La Seu | 4,726 €/m² | +2,6 % | Cathedral, heritage site |
| El Pilar (Velluters) | 4,410 €/m² | +10,6 % | Gentrification |
| El Carme | 4,025 €/m² | −1,3 % | The most touristy |
16 TheEixample
Russafa (Ruzafa), Pla del Remei, Gran Via
| Neighborhood | Price per square meter | Year-over-year | Good to Know |
|---|---|---|---|
| Pla del Remei | 5,946 €/m² | +10,8 % | The Most Expensive in Valencia |
| Gran Via | 5,264 €/m² | +4,9 % | Prestige, wide avenues |
| Russafa (Ruzafa) | 4,656 €/m² | +0,2 % | Trendy, highly sought-after |
Idealista does not publish reports for these three outlying districts (the pedanías). The figures below are therefore fromIndomio (September 2026): they are for informational purposes only and should be used with caution.
~Towns ofthe West Area Code
Benimàmet, Beniferri
| Neighborhood | Price per square meter | Year-over-year | Good to Know |
|---|---|---|---|
| Benimàmet | n.a. | n.a. | Subway Line 1, connected |
| Beniferri | n.a. | n.a. | Quiet, residential |
~Towns ofthe South Area Code
Forn d'Alcedo, Castellar-l'Oliveral, Pinedo, El Saler, El Palmar, El Perellonet, La Torre, Faitanar
| Neighborhood | Price per square meter | Year-over-year | Good to Know |
|---|---|---|---|
| El Perellonet / Pinedo | n.a. | n.a. | Waterfront, seasonal |
| La Torre / Castellar | n.a. | n.a. | Permanent residence |
| El Saler / El Palmar | n.a. | n.a. | Albufera Nature Reserve |
~Pobles delNord Area Code
Benifaraig, Poble Nou, Carpesa, Cases de Bàrcena, Mauella, Massarrojos, Borbotó
| Neighborhood | Price per square meter | Year-over-year | Good to Know |
|---|---|---|---|
| Massarrojos | n.a. | n.a. | Quiet residential area, near the subway |
| Carpesa / Poble Nou | n.a. | n.a. | Rural districts |
| Benifaraig / Borbotó | n.a. | n.a. | Very accessible |
Sources: Idealista reports “Evolución del precio de la vivienda” (sales and rentals), September 2026, for the 16 districts covered. Neighborhood prices are taken from the same reports: the month is specified below each table, as some district pages have not yet been updated for September. The three outlying districts (Pobles del Sud, Pobles de l'Oest, Pobles del Nord) do not have Idealista reports: their data comes fromIndomio (September 2026) and is for informational purposes only. The gross yield is a Terreta calculation: rent × 12 ÷ sale price.
Key Facts: Real Estate Prices in Valence in 2026
Real Estate Prices in Valence in 2026: What's the State of the Market?
Valencia has solidified its position as Spain’s third-largest real estate market, behind Madrid and Barcelona. In September 2026, the average price per square meter reached €3,473, very close to its all-time high of €3,485 set in July 2026, up 5.1% year-over-year, according to Idealista. On the rental side, the average rent stood at €16.3 per square meter per month, up 3.1%, according to Idealista.
Consequently, the average gross yield is around 5.6%, according to Terreta’s calculations. However, this average masks dramatic variations. For example, Natzaret, the most affordable neighborhood in Poblats Marítims, sells for €2,186 per square meter—more than two and a half times cheaper than Pla del Remei in the Eixample, which sells for €5,946 per square meter, according to Idealista. In short: same city, same macroeconomic data, but radically different yields.
Furthermore, the market is not growing at the same pace everywhere. Benimaclet, in particular, posted a 19.8% increase year-over-year, Rascanya 16.2%, and Benicalap 14.6%, while Camins al Grau (+0.3%) and La Saïdia (+0.2%) are treading water, according to Idealista. Consequently, the question is no longer “Should you invest in Valencia?” but “In which neighborhood, specifically? ”
Actual Fees Charged by Spanish Notaries, by Neighborhood
The figures from Idealista and Indomio are based on the prices listed in the listings. However, to find out the actual price paid for real estate in Valencia, there is another very useful source: the official data from the Spanish notary system. It tracks the prices of sales that have actually been finalized at notary offices, neighborhood by neighborhood.
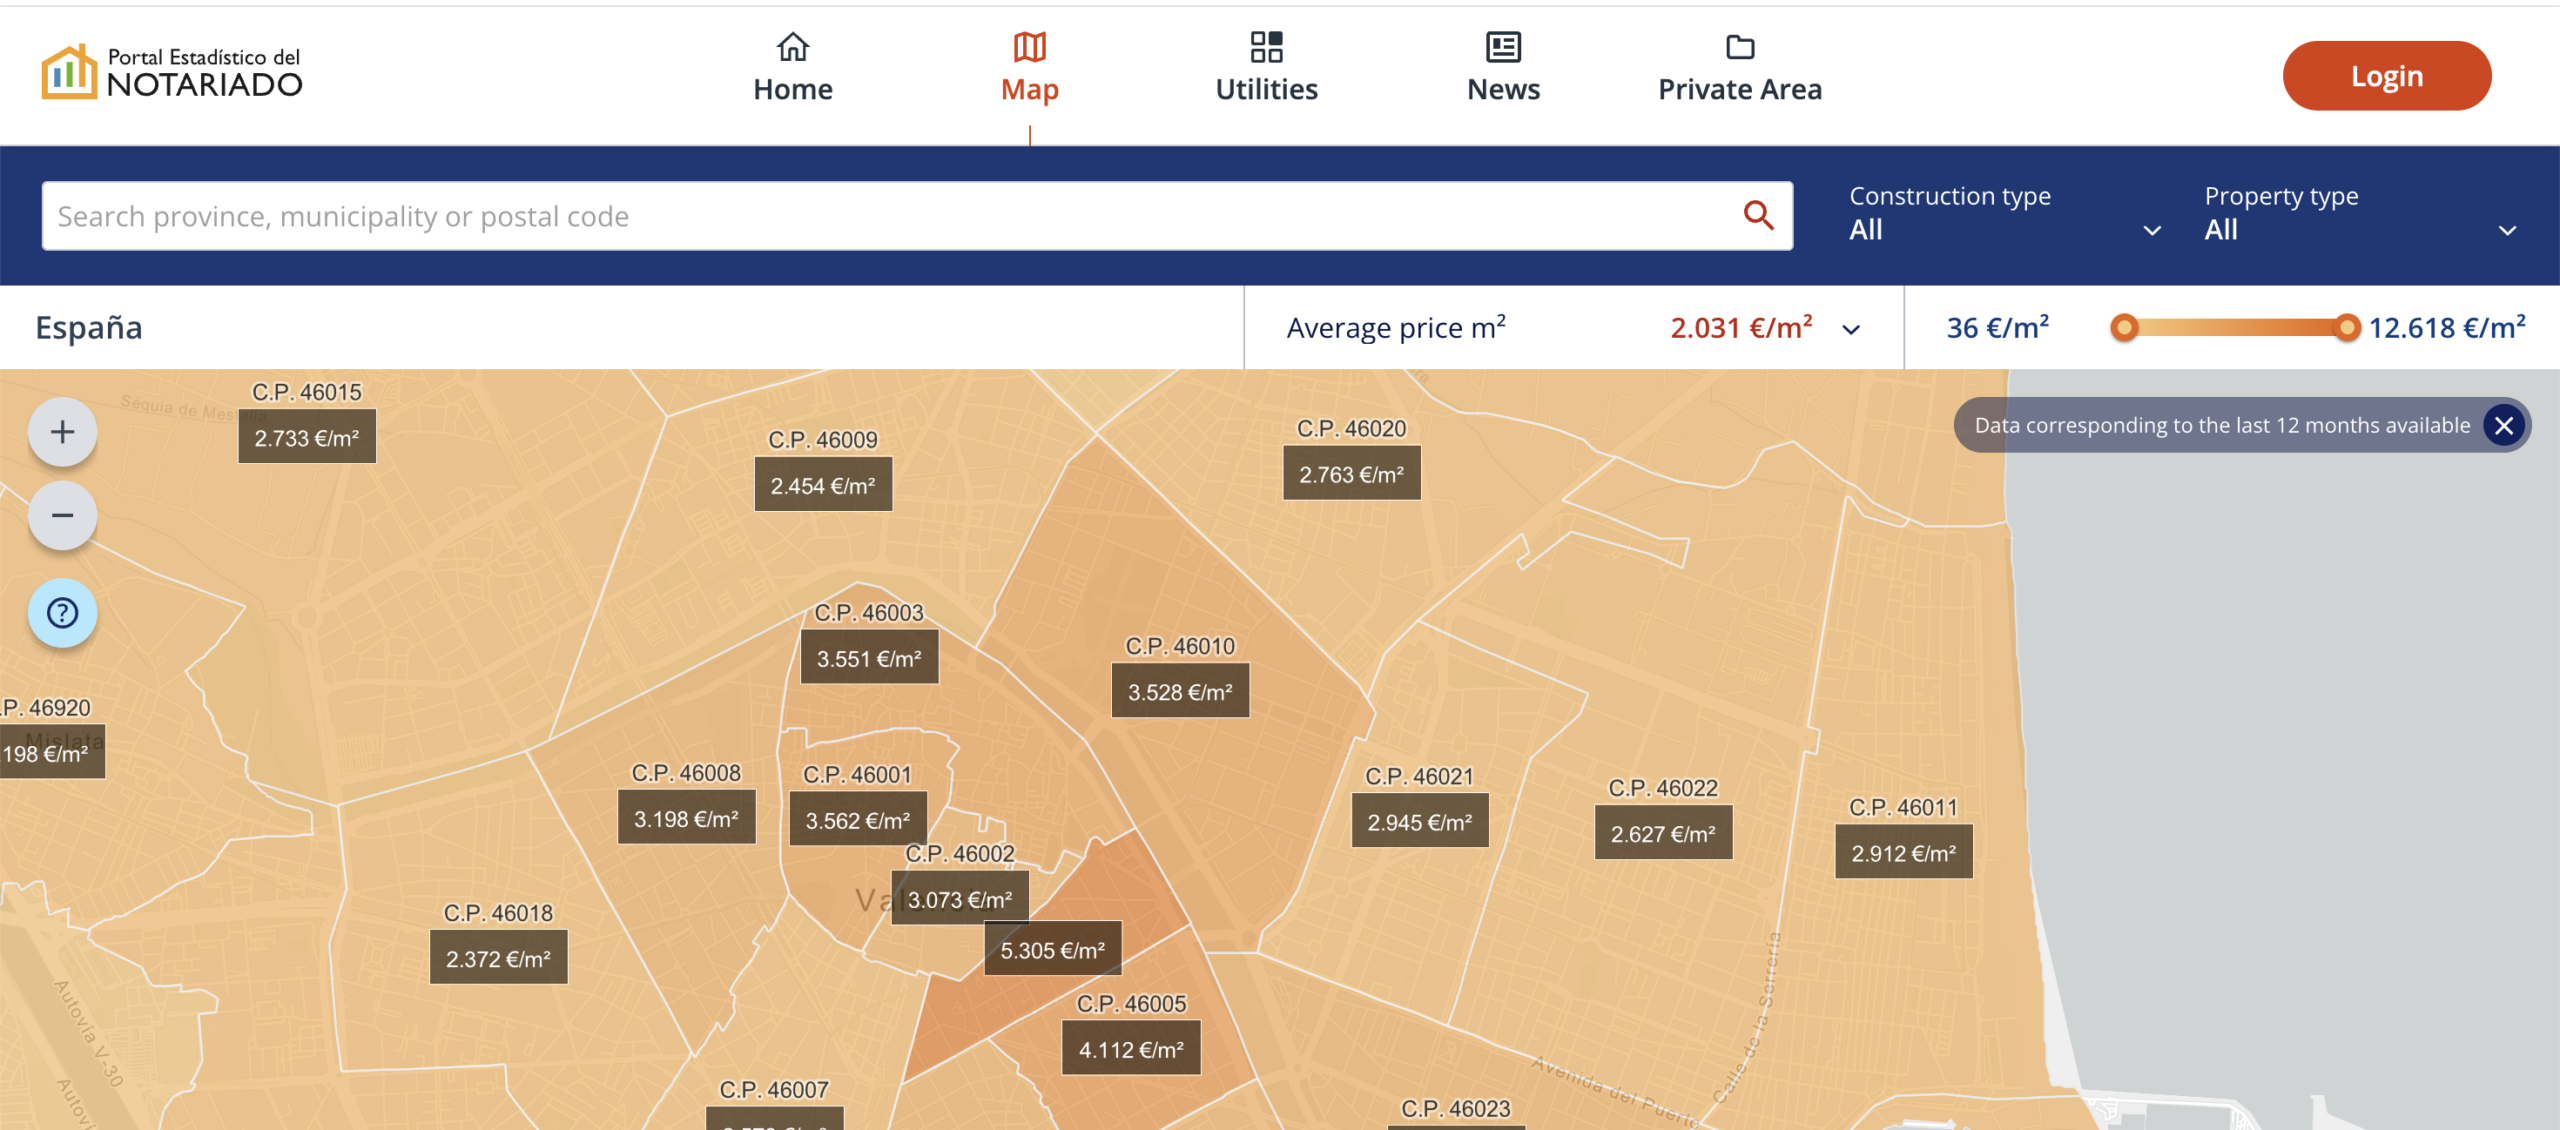
In general, the final sale prices are lower than the listed prices: this is because they reflect negotiations and include only properties that were actually sold. These two sources therefore complement each other: on the one hand, listings show the current market and its trends; on the other, notaries show what buyers actually paid. Before making an offer, comparing the two remains the best way to determine whether a price is fair. You can view the map yourself, neighborhood by neighborhood, on the Spanish Notaries’ real estate portal.
Top 5 Most Profitable Districts in Valencia
1. Rascanya, 7.1% and undergoing a major transformation
Orriols, Torrefiel, Sant Llorenç: three working-class neighborhoods in the north that have long suffered from a bad reputation. However, by 2026, the landscape is changing rapidly. Indeed, the new metro lines, the proximity to the future Nou Mestalla stadium, and the gradual revitalization are attracting a new generation of tenants and investors. As a result, at €2,489/m² (+16.2% year-over-year) with a rent of €14.7/m² (Idealista, Sept. 2026), the yield remains the highest in the dense urban area.
2. Benicalap, 6.9%, with rents following suit
Here, the trend is twofold: prices have risen by +14.6% and rents by +8.8% over the past year, well above the Idealista city average , Sept. 2026. In other words, rental demand remains strong. Furthermore, Benicalap and Ciutat Fallera benefit from their location between the city center and the north, with excellent public transportation links. Ciutat Fallera remains one of the most affordable neighborhoods in Valencia, at €2,319/m² (Idealista, August 2026).
3. L'Olivereta, 6.2%, and a comeback in the works
Prices in L'Olivereta stand at €2,692 per square meter, up 9.2% year-over-year (Idealista, Sept. 2026). While rents there have stagnated (−1.3%), the gross yield remains solid. On the ground, Tres Forques (+15.1%) is leading the way, while Nou Moles remains the most sought-after neighborhood in the district.
4. Jesús, 6.1% and modest profitability
Although Jesús is a residential neighborhood that is often overlooked, it offers a gross return of 6.1% at €2,859 per square meter, with rents up 9.6% (Idealista, Sept. 2026). Because it is quieter and less speculative than its neighbors, it also attracts a stable tenant base, particularly families and young professionals.
5. Poblats Marítims, 6.0% and a disparity among neighborhoods
This district perfectly illustrates why it’s important to look at the neighborhood level. Indeed, Natzaret, at €2,186 per square meter, is much less expensive than El Cabanyal-Canyamelar, at €3,750 per square meter ( Idealista, Sept. 2026). But does that mean you should invest in Natzaret and forget about El Cabanyal? Not at all—as we’ll see in the section on El Cabanyal, Geoffroy’s favorite neighborhood. In short, the 6.0% average for the Poblats Marítims masks very different realities depending on where you look.
Geoffroy's favorite neighborhood: Le Cabanyal
I have to be honest: on paper, Cabanyal isn’t the most profitable neighborhood in Valencia. Yet it’s my favorite neighborhood, and I’ve actually bought three apartments there. Not for the gross return, but rather for what this neighborhood represents: a former fishing village that’s been revitalized, right on the beach, with a unique energy that few other places in Valencia have.
At €3,750 per square meter and up 10.8% year-over-year (Idealista, Sept. 2026), El Cabanyal-Canyamelar is the most expensive neighborhood in the Poblats Marítims. Nevertheless, it remains significantly less expensive than the historic center (Ciutat Vella, €4,863 per square meter) or the Eixample (€5,106 per square meter) ( Idealista, Sept. 2026). And above all, it’s a truly wonderful place to live.
My three apartments in Cabanyal
Beyond the numbers, what makes Cabanyal unique is its atmosphere. It is, in fact, an authentic, still working-class neighborhood with its own shops, markets, restaurants, and a beach within walking distance. Furthermore, it has been undergoing extensive redevelopment for several years, creating real potential for long-term appreciation.
Our recommendations for exploring the neighborhood
Finally, here are a few must-see spots to help you get to know the neighborhood when you come to visit:
In short, if you're thinking about investing in Valencia and haven't yet visited the Cabanyal, I highly recommend that you do so. This neighborhood has a spirit that numbers can't quite capture.
Balanced Districts: The Investor's Comfort Zone
With a gross yield ranging from 5.0% to 5.9% —as calculated by Terreta based on Idealista data from September 2026—these districts offer good liquidity, creditworthy tenants, and lower volatility. They are therefore particularly well-suited for a first investment.
- Campanar (5.8%), a modern neighborhood with a major hospital; rents are rising sharply (+12.8%).
- La Saïdia (5.7%), near the Jardins de Viveros, at €2,999 per square meter.
- Camins al Grau (5.7%), near the Cité des Arts; for commercial rental inquiries.
- Four neighborhoods (5.6%), including Malilla, Monteolivet, and the Cité des Arts.
- Patraix (5.5%), still available at €2,910 per square meter.
- Algirós (5.2%), near the universities, in the upmarket Ciutat Jardí neighborhood.
- Outside the city limits (5.2%), central location, low vacancy rate, El Botànic is very popular.
- Benimaclet (5.0%), structural student demand, and the city’s sharpest price increase (+19.8%).
Premium districts: Focus on value rather than cash flow
Three districts exceed 4,000 €/m² and embody Valencia’s “luxury” image: L’Eixample (€5,106 per square meter, with Pla del Remei at €5,946 per square meter), Ciutat Vella (€4,863 per square meter), and El Pla del Real (€4,188 per square meter). Idealista, Sept. 2026. However, their gross yields are capped between 4.3% and 4.7%, and their prices are now rising more slowly (from +2.1% to +5.6% year-over-year). These areas therefore offer asset security rather than cash flow.
Where should you invest in Valence based on your goals?
Estimated budgets calculated by Terreta for an apartment ranging from 60 to 80 m², based on Idealista prices from September 2026, excluding purchase costs and renovation expenses.
🎯 Maximize cash flow
- Rascanya (7.1%), Benicalap (6.9%), L'Olivereta (6.2%)
- Target neighborhoods: Torrefiel, Els Orriols, Ciutat Fallera, Tres Forques
- Budget: approximately €150,000 to €230,000
🌊 Beach + returns + quality of life
- Poblats Marítims (6.0%): El Cabanyal, Natzaret, La Malvarrosa
- Natzaret offers the best value for money in the district
- Budget: approximately €130,000 in Natzaret, up to €300,000 in Cabanyal
⚖️ Balancing returns and appreciation
- Campanar, Camins al Grau, Quatre Carreres, Patraix
- Target neighborhoods: Malilla, Na Rovella, Vara de Quart, Aiora
- Budget: approximately €175,000 to €290,000
🏛️ Wealth Management Strategy and Capital Appreciation
- The Eixample (Ruzafa, Gran Via, Pla del Remei), Ciutat Vella, El Pla del Real
- Budget: approximately €250,000 to €480,000 or more
- Profile: capital accumulation, second home, long-term resale
Want to replicate this analysis for another city?
This analysis was produced entirely using Claude (Anthropic) by combining public data from Idealista. As a result, the method can be replicated for any Spanish city for which Idealista reports are available.
To do this, simply copy and paste the prompt below into Claude.ai, replacing the URLs with those for your target city.
The prompt — copy this into Claude.ai
Adapted here for Madrid. Replace the URLs and the city name for any other Idealista destination.
I'd like you to compile a ranking of gross rental yields by district in Madrid, using exactly the same methodology as the one used for Valencia here: https://terretaspain.com/most-profitable-districts-valencia-2026/
Data sources (Idealista, official data): - Sale prices (city): https://www.idealista.com/sala-de-prensa/informes-precio-vivienda/venta/madrid-comunidad/madrid-provincia/madrid/ - Rental prices (city): https://www.idealista.com/sala-de-prensa/informes-precio-vivienda/alquiler/madrid-comunidad/madrid-provincia/madrid/
For each district, see the dedicated pages. Example for Arganzuela: - Sales: https://www.idealista.com/sala-de-prensa/informes-precio-vivienda/venta/madrid-comunidad/madrid-provincia/madrid/arganzuela/ - Rentals: https://www.idealista.com/sala-de-prensa/informes-precio-vivienda/alquiler/madrid-comunidad/madrid-provincia/madrid/arganzuela/
Expected table (sorted from most to least profitable): - Rank - District + list of neighborhoods (barrios) within it - Sale price in euros per square meter, with a link to the Idealista source - Year-over-year change in sale price - Rent in euros per square meter per month, with a link to the Idealista source - Year-over-year change in rent - Gross yield = (Rent × 12) divided by Sale price
Important: If certain districts do not have an official Idealista report page, place them at the end of the table with a clear warning banner, and use Indomio data as an alternative source.
Output format: complete HTML table, in French, with clickable links to each Idealista source page. White background, with borders colored according to performance level (bright green for high, orange for medium, red for low, and yellow for non-Idealista data).
Methodology & Sources
This article draws on three sources, cited next to each figure. First, the Idealista reports titled “Evolución del precio de la vivienda” from September 2026 (sales and rentals), our primary source for the city, the 16 districts covered, and their neighborhoods. Second, Indomio (September 2026), for the three outlying districts not covered by the Idealista report and as a point of comparison for the citywide average. Finally, the Spanish Notary Public’s real estate portal, for actual transaction prices.
The gross yield is a Terreta calculation based on the formula: (Rent in €/m² × 12) ÷ Sale price in €/m². However, it does not take into account service charges, taxes (IBI), management fees, rental vacancies, or French tax laws. In practice, therefore, expect the net yield to be 1 to 2 percentage points lower.
FAQ: Real Estate Prices and Investment in Valence in 2026
Is Valencia cheaper than Madrid and Barcelona?
Yes. In September 2026, according to Idealista, the average real estate price was €3,473 per square meter in Valencia, compared to €5,462 per square meter in Barcelona and €6,458 per square meter in Madrid. Madrid is therefore 86% more expensive than Valencia, and Barcelona is 57% more expensive.
What will real estate prices be like in Valencia, Spain, in 2026?
In September 2026, the average real estate price in Valencia was €3,473 per square meter, up 5.1% year-over-year, according to Idealista. Indomio, another real estate listing portal, reported a figure of nearly €3,403 per square meter for the same month. Prices vary significantly by neighborhood: approximately €2,186 per square meter in Natzaret, €3,750 per square meter in Cabanyal, and up to €5,946 per square meter in Pla del Remei, according to Idealista.
What is the least expensive neighborhood in Valencia?
In the densely populated city, Natzaret (Poblats Marítims) is the most affordable neighborhood at 2,186 €/m², ahead of Ciutat Fallera (2,319 €/m²) and Els Orriols (2,352 €/m²), according to Idealista. As for the outlying districts, such as Pobles de l'Oest (€2,218 per square meter) and Pobles del Sud (€2,345 per square meter), they fall within the same range , according to Indomio, which provides this information for reference only.
What is the difference between the prices listed in ads and the notary fees?
Listings (Idealista, Indomio) show the asking price set by sellers. In contrast, notaries publish the actual sale price agreed upon at closing, which is generally lower because it reflects the negotiation. The Spanish Notary Map allows you to compare the two, neighborhood by neighborhood.
Which district will be the most profitable in Valencia in 2026?
According to our calculations based on Idealista data from September 2026, Rascanya is the most profitable district with a gross return of 7.1%, ahead of Benicalap (6.9%) and L'Olivereta (6.2%).
Is Cabanyal a good investment?
El Cabanyal-Canyamelar was priced at 3,750 €/m² in September 2026, up 10.8% year-over-year, according to Idealista. Its location between the city and the sea, its ongoing redevelopment, and its strong rental demand make it an attractive option, even though its gross yield is lower than that of the working-class neighborhoods in the north. As such, for a strategy combining yield, quality of life, and appreciation potential, it is one of the best neighborhoods in Valencia.
What is the difference between a district and a neighborhood in Valencia?
Valencia is divided into 19 administrative districts, which are further subdivided into 87 neighborhoods (barrios). For example, El Cabanyal is a neighborhood in the Poblats Marítims district. However, the price difference between neighborhoods within the same district can exceed 70% (Natzaret at €2,186/m² versus El Cabanyal at €3,750/m²) according to Idealista.
Why don't some districts have Idealista data?
Idealista publishes official statistical reports only for areas with a sufficient volume of listings. However, the Pobles del Nord, del Sud, and de l'Oest do not meet this threshold. Therefore, we use data from Indomio for these areas, which is presented for informational purposes only.
What are the tax implications for a French investor?
Spain applies a 19% IRNR tax on net rent for EU residents. In addition, the Franco-Spanish tax treaty prevents double taxation. Finally, it is strongly recommended that you hire a specialized Spanish accountant.
Conclusion
With an average real estate price of €3,473 per square meter (Idealista, Sept. 2026), Valencia remains significantly less expensive than Madrid and Barcelona, and its prices continue to rise. Ultimately, Valencia in 2026 is a multi-tiered market. First, the working-class outlying districts (Rascanya, Benicalap) still offer the highest returns within the dense urban fabric. Next, the seaside neighborhoods of Poblats Marítims combine returns with quality of life. Conversely, the premium central districts are primarily driven by capital appreciation. Finally, neighborhoods like Cabanyal offer something that the numbers don’t fully capture: a genuine quality of life, just a stone’s throw from the sea.
For investment potential: Rascanya, Benicalap, L'Olivereta. If you're looking for quality of life and the beach: El Cabanyal, La Malvarrosa. For a good balance: Patraix, Quatre Carreres. Finally, for historic charm: L'Eixample, Ciutat Vella. Ultimately, the choice depends on your long-term goals, your capital, and what you're really looking for.
Talk to an expert
Our team analyzes your situation, selects neighborhoods that match your goals, and guides you through the process from the search phase all the way to closing.
Contact us →